|
|
MATLAB |
Microsoft Power BI |
SAS |
SPSS |
SPSS Amos |
STATA |
|---|---|---|---|---|---|---|
|
Coding Language(s) |
MATLAB |
Power Query (M) DAX Python, R |
SAS |
R Python SaxBasic |
R Python SaxBasic |
ado Mata |
|
User Interface Language(s) |
Available in most languages |
Available in 42 languages |
Available in most languages |
English, Chinese, French, German, Italian, Japanese, Spanish |
English, Chinese, French, German, Italian, Japanese, Spanish |
English, Spanish & Japanese |
|
Operating System |
Windows Mac OS X Linux |
Windows |
Windows Mac OS X Linux |
Windows Mac OS X Linux |
Windows
|
Window Mac OS X Linux |
|
Cost (please see commercial websites for latest prices) |
Free to UO users Student License, Single User: $500 Standard License, Single User: $2,150 |
Power BI Desktop is free. Power BI Pro free to UO faculty/staff. Pro License, Single User: $9.99 monthly
|
Free to UO users Cost provided via price quote |
Free to UO users Standard License, Single User (1 year): $2,610 |
Free to UO users Standard License, Single User (1 year): $787 |
Free to UO users (select departments only). Available on PLC computers. Student License, Single User: $89 Standard License, Single User: $1,195 |
MATLAB is a quantitative analysis software optimized for solving scientific and engineering problems. Typical users include education-based (specifically linear algebra and numerical analysis), scientists, and engineers. Provided by UO through CASIT services.
| Pros | Cons |
|---|---|
|
|
Import and Export File Capabilities
Import: Excel files (.xls, .xlsx), Text files (.txt, .dat, .csv, .m), Web-based files (.xml) & additional formats (.json)
Export: Excel files (.xls, .xlsx), Text files (.txt, .dat, .csv), Web-based files (.xml) & additional formats (.json)
Microsoft Power BI and Power BI Pro provide users with cloud-based or desktop-based access to quantitative analysis. Typical users include educators and profit/nonprofit corporations. Provided by UO through the Technology Service Desk.
| Pros | Cons |
|---|---|
|
|
Import and Export File Capabilities
Import: Excel files (.xls, .xlsx), Text files (.csv), Database files & Power BI files (.pbix)
Export: Text files (.csv) & Web-based files
View this Microsoft PowerBI video tutorial to learn about PowerBI and how to get started. Closed captions are available.
SAS is quantitative analysis software predominantly used for data management and statistical procedures. Typical users include financial services, government, manufacturing, health and life sciences, and profit/nonprofit corporations. Provided by UO through the Technology Service Desk.
| Pros | Cons |
|---|---|
|
|
Import and Export File Compatibility
Import: Excel files (.xls, .xlsx), Text files (.txt, .dat, .csv), Web-based files (.xml) & additional formats (.sav, .dta, .jmp)
Export: Excel files (.xls, .xlsx), Text files (.txt, .dat, .csv), Web-based files (.xml) & additional formats (.sav, .dta, .jmp)
SAS provides a SAS video demo giving an overview of visual analytics and how SAS can be utilized. Closed captions are available.
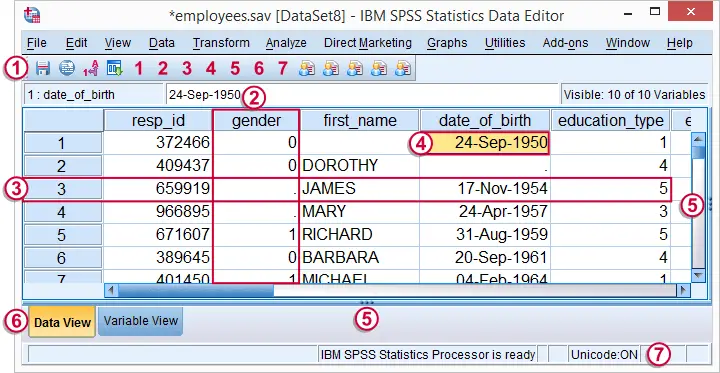
SPSS is quantitative analysis software. SPSS Amos is a product edition that features the ability to build attitudinal and behavioral models to show relationships among variables. Typical users include the social sciences, health sciences, marketing, and academia. SPSS and SPSS Amos are provided by UO through the Technology Service Desk.
| Pros | Cons |
|---|---|
|
|
Import and Export File Capabilities
Import: Excel files (.xls, .xlsx), Text files (.csv, .txt, .dat) & additional formats (.sas7bdat, .dta, .sav)
Export: Excel files (.xls, .xlsx), Text files (.csv, .dat) & additional formats (.sas7bdat, .dta, .sav, .sps)
STATA is quantitative analysis software. It specifically works well for data management regarding panel data, survey data, and multiple imputations. Typical users include economists, sociologists, political scientists, and researchers. STATA is available on the UO Virtual Computer Lab and UO Libraries Windows computers.
| Pros | Cons |
|---|---|
|
|
Import and Export File Capabilities
Import: Excel files (.xls, .xlsx), Text files (.txt, .csv, .dat), Web-based files (.xml) & additional formats (.xpt, .dta, .do)
Export: Excel files (.xls, .xlsx), Text files (.txt, .csv, .dat), Web-based files (.xml) & additional formats (.xpt, .dta, .do)

 Quantitative Methods for Health Research by
A practical introduction to epidemiology, biostatistics, and research methodology for the whole health care community This comprehensive text, which has been extensively revised with new material and additional topics, utilizes a practical slant to introduce health professionals and students to epidemiology, biostatistics, and research methodology. It draws examples from a wide range of topics, covering all of the main contemporary health research methods, including survival analysis, Cox regression, and systematic reviews and meta-analysis--the explanation of which go beyond introductory concepts. This second edition of Quantitative Methods for Health Research: A Practical Interactive Guide to Epidemiology and Statistics also helps develop critical skills that will prepare students to move on to more advanced and specialized methods. A clear distinction is made between knowledge and concepts that all students should ensure they understand, and those that can be pursued further by those who wish to do so. Self-assessment exercises throughout the text help students explore and reflect on their understanding. A program of practical exercises in SPSS (using a prepared data set) helps to consolidate the theory and develop skills and confidence in data handling, analysis, and interpretation. Highlights of the book include: Combining epidemiology and bio-statistics to demonstrate the relevance and strength of statistical methods Emphasis on the interpretation of statistics using examples from a variety of public health and health care situations to stress relevance and application Use of concepts related to examples of published research to show the application of methods and balance between ideals and the realities of research in practice Integration of practical data analysis exercises to develop skills and confidence Supplementation by a student companion website which provides guidance on data handling in SPSS and study data sets as referred to in the text Quantitative Methods for Health Research, Second Edition is a practical learning resource for students, practitioners and researchers in public health, health care and related disciplines, providing both a course book and a useful introductory reference.
Quantitative Methods for Health Research by
A practical introduction to epidemiology, biostatistics, and research methodology for the whole health care community This comprehensive text, which has been extensively revised with new material and additional topics, utilizes a practical slant to introduce health professionals and students to epidemiology, biostatistics, and research methodology. It draws examples from a wide range of topics, covering all of the main contemporary health research methods, including survival analysis, Cox regression, and systematic reviews and meta-analysis--the explanation of which go beyond introductory concepts. This second edition of Quantitative Methods for Health Research: A Practical Interactive Guide to Epidemiology and Statistics also helps develop critical skills that will prepare students to move on to more advanced and specialized methods. A clear distinction is made between knowledge and concepts that all students should ensure they understand, and those that can be pursued further by those who wish to do so. Self-assessment exercises throughout the text help students explore and reflect on their understanding. A program of practical exercises in SPSS (using a prepared data set) helps to consolidate the theory and develop skills and confidence in data handling, analysis, and interpretation. Highlights of the book include: Combining epidemiology and bio-statistics to demonstrate the relevance and strength of statistical methods Emphasis on the interpretation of statistics using examples from a variety of public health and health care situations to stress relevance and application Use of concepts related to examples of published research to show the application of methods and balance between ideals and the realities of research in practice Integration of practical data analysis exercises to develop skills and confidence Supplementation by a student companion website which provides guidance on data handling in SPSS and study data sets as referred to in the text Quantitative Methods for Health Research, Second Edition is a practical learning resource for students, practitioners and researchers in public health, health care and related disciplines, providing both a course book and a useful introductory reference.
 Introduction to Quantitative Data Analysis in the Behavioral and Social Sciences by
Guides readers through the quantitative data analysis process including contextualizing data within a research situation, connecting data to the appropriate statistical tests, and drawing valid conclusions Introduction to Quantitative Data Analysis in the Behavioral and Social Sciences presents a clear and accessible introduction to the basics of quantitative data analysis and focuses on how to use statistical tests as a key tool for analyzing research data. The book presents the entire data analysis process as a cyclical, multiphase process and addresses the processes of exploratory analysis, decision-making for performing parametric or nonparametric analysis, and practical significance determination. In addition, the author details how data analysis is used to reveal the underlying patterns and relationships between the variables and connects those trends to the data's contextual situation. Filling the gap in quantitative data analysis literature, this book teaches the methods and thought processes behind data analysis, rather than how to perform the study itself or how to perform individual statistical tests. With a clear and conversational style, readers are provided with a better understanding of the overall structure and methodology behind performing a data analysis as well as the needed techniques to make informed, meaningful decisions during data analysis. The book features numerous data analysis examples in order to emphasize the decision and thought processes that are best followed, and self-contained sections throughout separate the statistical data analysis from the detailed discussion of the concepts allowing readers to reference a specific section of the book for immediate solutions to problems and/or applications. Introduction to Quantitative Data Analysis in the Behavioral and Social Sciences also features coverage of the following: * The overall methodology and research mind-set for how to approach quantitative data analysis and how to use statistics tests as part of research data analysis * A comprehensive understanding of the data, its connection to a research situation, and the most appropriate statistical tests for the data * Numerous data analysis problems and worked-out examples to illustrate the decision and thought processes that reveal underlying patterns and trends * Detailed examples of the main concepts to aid readers in gaining the needed skills to perform a full analysis of research problems * A conversational tone to effectively introduce readers to the basics of how to perform data analysis as well as make meaningful decisions during data analysis Introduction to Quantitative Data Analysis in the Behavioral and Social Sciences is an ideal textbook for upper-undergraduate and graduate-level research method courses in the behavioral and social sciences, statistics, and engineering. This book is also an appropriate reference for practitioners who require a review of quantitative research methods. Michael J. Albers, Ph.D., is Professor in the Department of English at East Carolina University. His research interests include information design with a focus on answering real-world questions, the presentation of complex information, and human-information interaction. Dr. Albers received his Ph.D. in Technical Communication and Rhetoric from Texas Tech University.
Introduction to Quantitative Data Analysis in the Behavioral and Social Sciences by
Guides readers through the quantitative data analysis process including contextualizing data within a research situation, connecting data to the appropriate statistical tests, and drawing valid conclusions Introduction to Quantitative Data Analysis in the Behavioral and Social Sciences presents a clear and accessible introduction to the basics of quantitative data analysis and focuses on how to use statistical tests as a key tool for analyzing research data. The book presents the entire data analysis process as a cyclical, multiphase process and addresses the processes of exploratory analysis, decision-making for performing parametric or nonparametric analysis, and practical significance determination. In addition, the author details how data analysis is used to reveal the underlying patterns and relationships between the variables and connects those trends to the data's contextual situation. Filling the gap in quantitative data analysis literature, this book teaches the methods and thought processes behind data analysis, rather than how to perform the study itself or how to perform individual statistical tests. With a clear and conversational style, readers are provided with a better understanding of the overall structure and methodology behind performing a data analysis as well as the needed techniques to make informed, meaningful decisions during data analysis. The book features numerous data analysis examples in order to emphasize the decision and thought processes that are best followed, and self-contained sections throughout separate the statistical data analysis from the detailed discussion of the concepts allowing readers to reference a specific section of the book for immediate solutions to problems and/or applications. Introduction to Quantitative Data Analysis in the Behavioral and Social Sciences also features coverage of the following: * The overall methodology and research mind-set for how to approach quantitative data analysis and how to use statistics tests as part of research data analysis * A comprehensive understanding of the data, its connection to a research situation, and the most appropriate statistical tests for the data * Numerous data analysis problems and worked-out examples to illustrate the decision and thought processes that reveal underlying patterns and trends * Detailed examples of the main concepts to aid readers in gaining the needed skills to perform a full analysis of research problems * A conversational tone to effectively introduce readers to the basics of how to perform data analysis as well as make meaningful decisions during data analysis Introduction to Quantitative Data Analysis in the Behavioral and Social Sciences is an ideal textbook for upper-undergraduate and graduate-level research method courses in the behavioral and social sciences, statistics, and engineering. This book is also an appropriate reference for practitioners who require a review of quantitative research methods. Michael J. Albers, Ph.D., is Professor in the Department of English at East Carolina University. His research interests include information design with a focus on answering real-world questions, the presentation of complex information, and human-information interaction. Dr. Albers received his Ph.D. in Technical Communication and Rhetoric from Texas Tech University.
 A Gentle Introduction to Effective Computing in Quantitative Research by
A practical guide to using modern software effectively in quantitative research in the social and natural sciences. This book offers a practical guide to the computational methods at the heart of most modern quantitative research. It will be essential reading for research assistants needing hands-on experience; students entering PhD programs in business, economics, and other social or natural sciences; and those seeking quantitative jobs in industry. No background in computer science is assumed; a learner need only have a computer with access to the Internet. Using the example as its principal pedagogical device, the book offers tried-and-true prototypes that illustrate many important computational tasks required in quantitative research. The best way to use the book is to read it at the computer keyboard and learn by doing. The book begins by introducing basic skills: how to use the operating system, how to organize data, and how to complete simple programming tasks. For its demonstrations, the book uses a UNIX-based operating system and a set of free software tools: the scripting language Python for programming tasks; the database management system SQLite; and the freely available R for statistical computing and graphics. The book goes on to describe particular tasks: analyzing data, implementing commonly used numerical and simulation methods, and creating extensions to Python to reduce cycle time. Finally, the book describes the use of LaTeX, a document markup language and preparation system.
A Gentle Introduction to Effective Computing in Quantitative Research by
A practical guide to using modern software effectively in quantitative research in the social and natural sciences. This book offers a practical guide to the computational methods at the heart of most modern quantitative research. It will be essential reading for research assistants needing hands-on experience; students entering PhD programs in business, economics, and other social or natural sciences; and those seeking quantitative jobs in industry. No background in computer science is assumed; a learner need only have a computer with access to the Internet. Using the example as its principal pedagogical device, the book offers tried-and-true prototypes that illustrate many important computational tasks required in quantitative research. The best way to use the book is to read it at the computer keyboard and learn by doing. The book begins by introducing basic skills: how to use the operating system, how to organize data, and how to complete simple programming tasks. For its demonstrations, the book uses a UNIX-based operating system and a set of free software tools: the scripting language Python for programming tasks; the database management system SQLite; and the freely available R for statistical computing and graphics. The book goes on to describe particular tasks: analyzing data, implementing commonly used numerical and simulation methods, and creating extensions to Python to reduce cycle time. Finally, the book describes the use of LaTeX, a document markup language and preparation system.
 Analyzing Quantitative Data by
A user-friendly, hands-on guide to recognizing and conducting proper research techniques in data collection Offering a unique approach to numerical research methods, Analyzing Quantitative Data: An Introduction for Social Researchers presents readers with the necessary statistical applications for carrying out the key phases of conducting and evaluating a research project. The book guides readers through the steps of data analysis, from organizing raw data to utilizing descriptive statistics and tests of significance, drawing valid conclusions, and writing research reports. The author successfully provides a presentation that is accessible and hands-on rather than heavily theoretical, outlining the key quantitative processes and the use of software to successfully draw valid conclusions from gathered data. In its discussion of methods for organizing data, the book includes suggestions for coding and entry into spreadsheets or databases while also introducing commonly used descriptive statistics and clarifying their roles in data analysis. Next, inferential statistics is explored in-depth with explanations of and instructions for performing chi-square tests, t-tests, analyses of variance, correlation and regression analyses, and a number of advanced statistical procedures. Each chapter contains explanations of when to use the tests described, relevant formulas, and sample computations. The book concludes with guidance on extracting meaningful conclusions from statistical tests and writing research reports that describe procedures and analyses. Throughout the book, Statistical Resources for SPSS® sections provide fundamental instruction for using SPSS® to obtain the results presented. Where necessary, the author provides basic theoretical explanations for distributions and background information regarding formulas. Each chapter concludes with practice problems, and a related website features derivations of the book's formulas along with additional resources for performing the discussed processes. Analyzing Quantitative Data is an excellent book for social sciences courses on data analysis and research methods at the upper-undergraduate and graduate levels. It also serves as a valuable reference for applied statisticians and practitioners working in the fields of education, medicine, business and public service who analyze, interpret, and evaluate data in their daily work.
Analyzing Quantitative Data by
A user-friendly, hands-on guide to recognizing and conducting proper research techniques in data collection Offering a unique approach to numerical research methods, Analyzing Quantitative Data: An Introduction for Social Researchers presents readers with the necessary statistical applications for carrying out the key phases of conducting and evaluating a research project. The book guides readers through the steps of data analysis, from organizing raw data to utilizing descriptive statistics and tests of significance, drawing valid conclusions, and writing research reports. The author successfully provides a presentation that is accessible and hands-on rather than heavily theoretical, outlining the key quantitative processes and the use of software to successfully draw valid conclusions from gathered data. In its discussion of methods for organizing data, the book includes suggestions for coding and entry into spreadsheets or databases while also introducing commonly used descriptive statistics and clarifying their roles in data analysis. Next, inferential statistics is explored in-depth with explanations of and instructions for performing chi-square tests, t-tests, analyses of variance, correlation and regression analyses, and a number of advanced statistical procedures. Each chapter contains explanations of when to use the tests described, relevant formulas, and sample computations. The book concludes with guidance on extracting meaningful conclusions from statistical tests and writing research reports that describe procedures and analyses. Throughout the book, Statistical Resources for SPSS® sections provide fundamental instruction for using SPSS® to obtain the results presented. Where necessary, the author provides basic theoretical explanations for distributions and background information regarding formulas. Each chapter concludes with practice problems, and a related website features derivations of the book's formulas along with additional resources for performing the discussed processes. Analyzing Quantitative Data is an excellent book for social sciences courses on data analysis and research methods at the upper-undergraduate and graduate levels. It also serves as a valuable reference for applied statisticians and practitioners working in the fields of education, medicine, business and public service who analyze, interpret, and evaluate data in their daily work.
 Quantitative and Statistical Research Methods by
Quantitative and Statistical Research Methods This user-friendly textbook teaches students to understand and apply procedural steps in completing quantitative studies. It explains statistics while progressing through the steps of the hypothesis-testing process from hypothesis to results. The research problems used in the book reflect statistical applications related to interesting and important topics. In addition, the book provides a Research Analysis and Interpretation Guide to help students analyze research articles. Designed as a hands-on resource, each chapter covers a single research problem and offers directions for implementing the research method from start to finish. Readers will learn how to: Pinpoint research questions and hypotheses Identify, classify, and operationally define the study variables Choose appropriate research designs Conduct power analysis Select an appropriate statistic for the problem Use a data set Conduct data screening and analyses using SPSS Interpret the statistics Write the results related to the problem Quantitative and Statistical Research Methods allows students to immediately, independently, and successfully apply quantitative methods to their own research projects.
Quantitative and Statistical Research Methods by
Quantitative and Statistical Research Methods This user-friendly textbook teaches students to understand and apply procedural steps in completing quantitative studies. It explains statistics while progressing through the steps of the hypothesis-testing process from hypothesis to results. The research problems used in the book reflect statistical applications related to interesting and important topics. In addition, the book provides a Research Analysis and Interpretation Guide to help students analyze research articles. Designed as a hands-on resource, each chapter covers a single research problem and offers directions for implementing the research method from start to finish. Readers will learn how to: Pinpoint research questions and hypotheses Identify, classify, and operationally define the study variables Choose appropriate research designs Conduct power analysis Select an appropriate statistic for the problem Use a data set Conduct data screening and analyses using SPSS Interpret the statistics Write the results related to the problem Quantitative and Statistical Research Methods allows students to immediately, independently, and successfully apply quantitative methods to their own research projects.
 Essential Statistics for Public Managers and Policy Analysts by
Known for its brevity and student-friendly approach, this new, Third Edition of Essential Statistics provides students with a strong conceptual foundation, but continues to stress application. Class-tested learning objectives, key term lists, and numerous tables, figures, and charts further enhance skill acquisition.
Essential Statistics for Public Managers and Policy Analysts by
Known for its brevity and student-friendly approach, this new, Third Edition of Essential Statistics provides students with a strong conceptual foundation, but continues to stress application. Class-tested learning objectives, key term lists, and numerous tables, figures, and charts further enhance skill acquisition.
 The SAGE Handbook of Quantitative Methodology for the Social Sciences by
The SAGE Handbook of Quantitative Methodology for the Social Sciences is the definitive reference for teachers, students, and researchers of quantitative methods in the social sciences, as it provides a comprehensive overview of the major techniques used in the field. Relevance to real-world problems in the social sciences is an essential ingredient of each chapter and makes this an invaluable resource.
The SAGE Handbook of Quantitative Methodology for the Social Sciences by
The SAGE Handbook of Quantitative Methodology for the Social Sciences is the definitive reference for teachers, students, and researchers of quantitative methods in the social sciences, as it provides a comprehensive overview of the major techniques used in the field. Relevance to real-world problems in the social sciences is an essential ingredient of each chapter and makes this an invaluable resource.
 Doing Survey Research by
Combining statistics and survey research methods in one volume, this short, practical book prepares students to conduct their own survey research and write up the results, as well as read and interpret other people's research. The text shows how to write a questionnaire, generate a sample, analyze data, and write up the results. The book also teaches how to interpret statistics and make decisions about which statistics to use, without requiring any calculations.
Doing Survey Research by
Combining statistics and survey research methods in one volume, this short, practical book prepares students to conduct their own survey research and write up the results, as well as read and interpret other people's research. The text shows how to write a questionnaire, generate a sample, analyze data, and write up the results. The book also teaches how to interpret statistics and make decisions about which statistics to use, without requiring any calculations.

1501 Kincaid Street
Eugene, OR 97403
P: 541-346-3053
F: 541-346-3485
